How to debug react
How to debug react
Отладка React для самых маленьких
Эта статья для тех, кто только начинает свой путь в написании больших React приложений, но все еще использует только console.log для их дебага. Мы с вами рассмотрим работу с расширением для браузера «React Developer Tools» на простом примере, который в дальнейшем вы сможете применить в своих проектах. Это расширение дает возможность просмотра дерева компонентов, их props, состояния и контекста. Также достаточно просто отловить неэффективные компоненты, которые подвергаются повторному рендерингу, посмотреть сколько на это уходит времени и построить графики для визуализации эффективности компонентов. Благодаря этой информации вы не только сможете оптимизировать ваше приложение, но и более глубоко изучить React и понять все тонкости работы с ним.
Все примеры я буду показывать в Google Chrome, но вы можете использовать любой другой браузер, где есть это расширение
Подготовка
Установите расширение «React Developer Tools».
Создайте учебный проект с помощью create-react-app
Если вы будуте создавать проект с нуля, то вам нужно будет настроить генерацию Source Map
Запустите проект и откройте консоль разработчика
Первые шаги
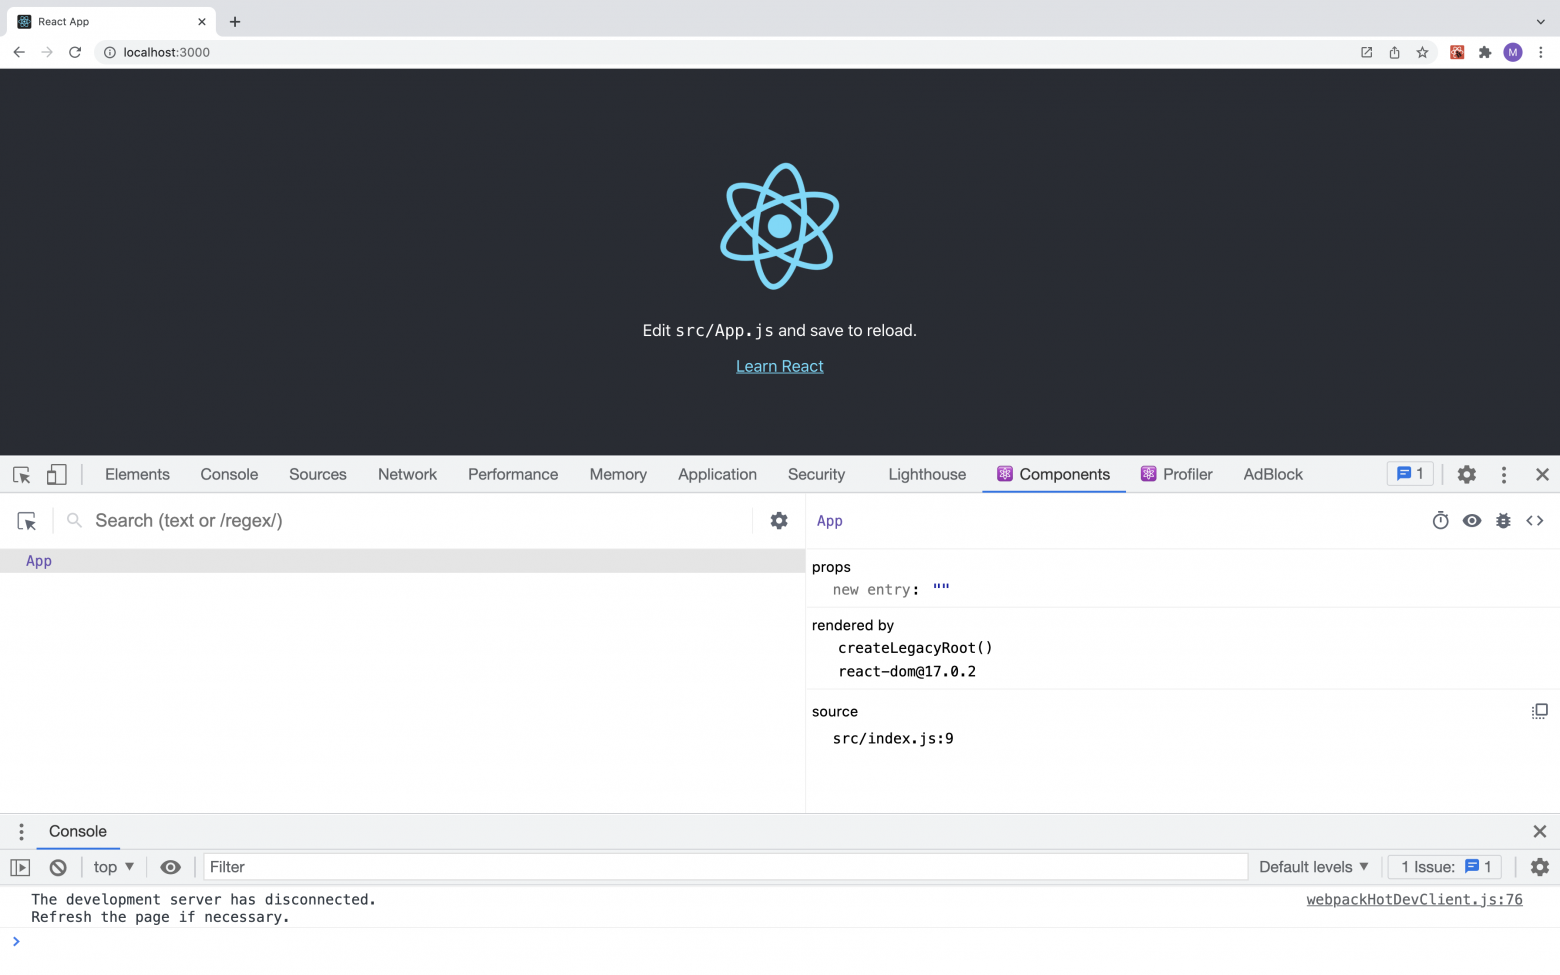
Для начала рассмотрим приложение, которое было создано в create-react-app:
Расширение добавляет 2 вкладки в консоли разработчика: Components и Profiler. Сейчас мы видим, что все приложение лежит в компоненте App, которое не имеет никаких props. Для подробного просмотра информации о компоненте в консоли, вы можете нажать на «жучка» в правом верхнем углу.
Усложняем проект
Напишем небольшое приложение в которое будем записывать тех, кто нам должен денег, и удалять, кто уже вернул.
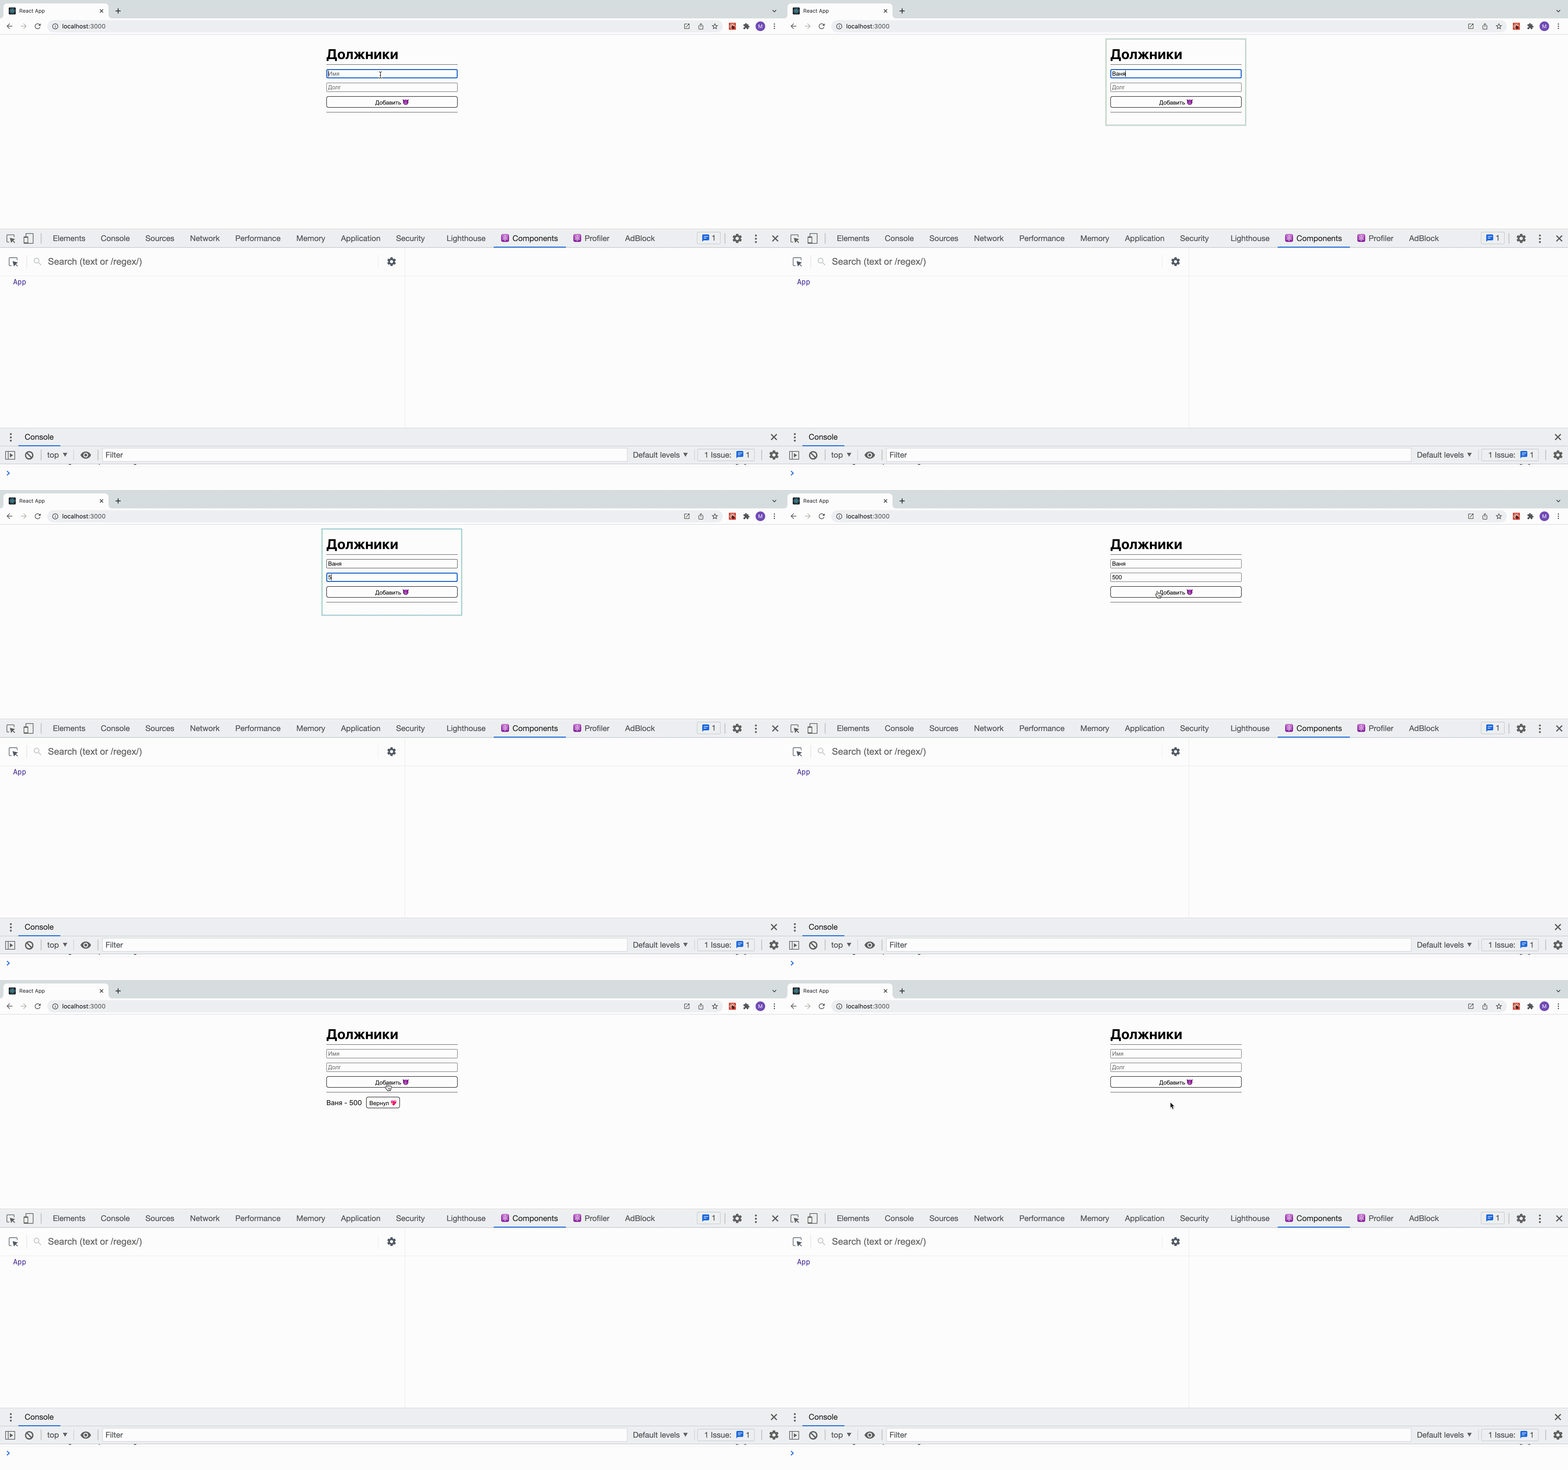
Я намеренно напишу сначала весь мой код в одном компоненте, чтобы посмотреть, как с помощью расширения можно отследить ненужные рендеры.
Чтобы включить подсветку рендеров, необходимо нажать на шестеренку на вкладке Components и поставить галочку у «Highlight updates when components render»
Вот код «плохого» компонента:
Смотрим в расширении
При каждом ререндере компонент подсвечивается рамкой. И как видно из гифки, все приложение ререндерится при вводе имени, долга, добавлении и удалении:
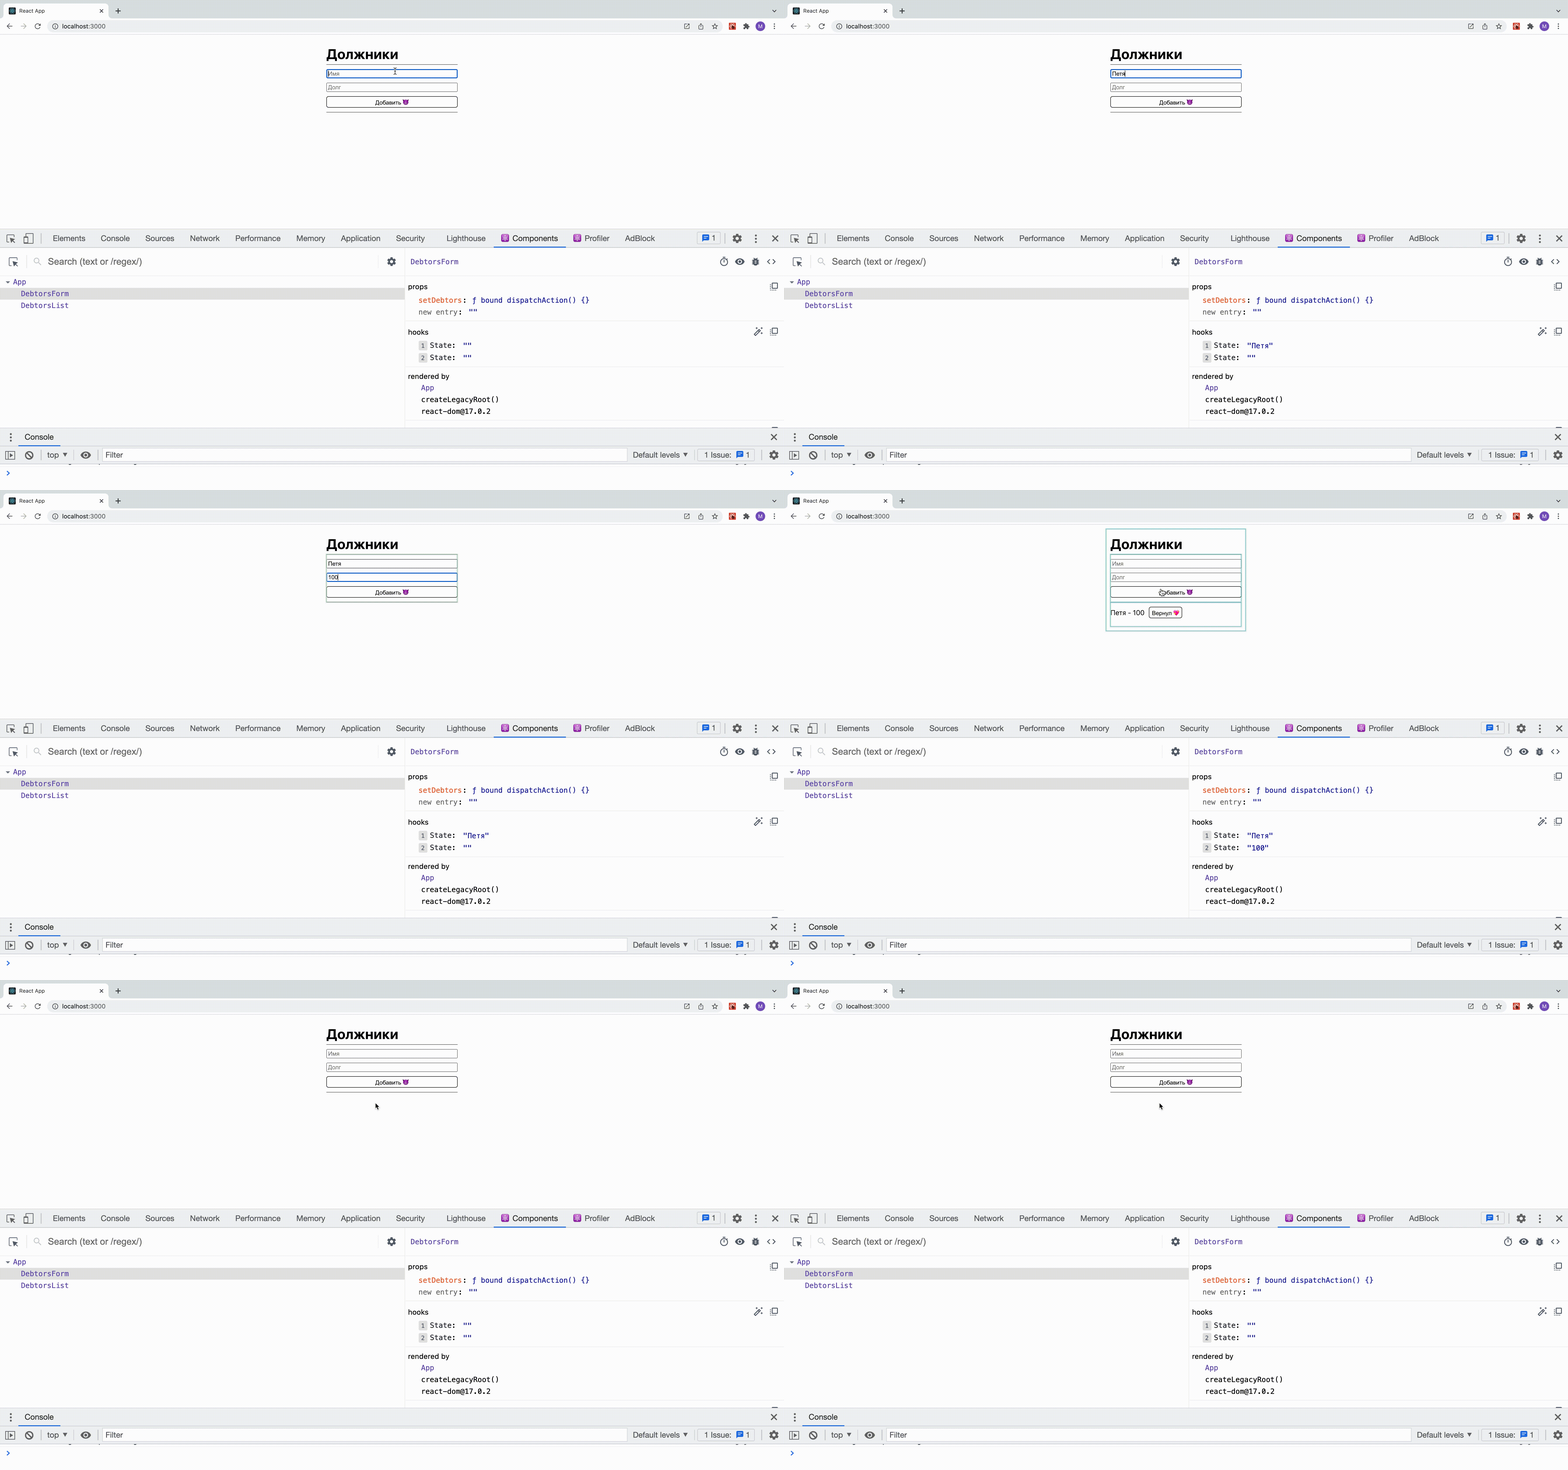
Давайте вынесем форму ввода, и список должников в отдельные компоненты. Теперь App выглядит следующим образом:
После чего поведение нашего приложения становится намного эффективнее, теперь ввод имени и долга не запускает ререндер заголовка и списка должников:
Чтобы увидеть имена state, вы можете нажать на «волшебную палочку» рядом со списком hooks, либо поставить это по умолчанию в настройках
Profiller
Отображение повторных рендеров дает быстрое представление о том, как компоненты связаны, но не дает данные для анализа конкретных компонентов. Чтобы получить больше информации, давайте посмотрим на вкладку Profiller.
Для того, чтобы использовать Profiller, щелкните синий кружок в левой части экрана, чтобы начать запись, и щелкните его еще раз, когда закончите:
Заключение
Расширение браузера React Developer Tools предоставляет вам мощный набор утилит для анализа приложения. С помощью этих инструментов вы сможете выявлять ошибки на этапе написания кода. Вы также можете изучить, как компоненты взаимодействуют друг с другом, что позволит оптимизировать их. Этот этап является важной частью процесса разработки и дает возможность исследования в разрезе всего приложения, а не только одного компонента.
Intro to debugging ReactJS applications
One of the most important things a developer should learn is how to (properly) debug an application in his language of choice. Knowing that not only allows you to easily find sources of errors in your code, but also teaches you about the inner working of the language thus preventing you from making the same error in the future.
I will cover a couple of techniques and tools you will find useful when developing ReactJS applications. For the sake of this article I will be using Chrome browser, but most of the techniques are universal and the tools exist for different browsers as well.
Please keep in mind that some of the described scenarios assume you have source maps enabled in your build. While debugging an app without sourcemaps enabled is possible it is much harder.
Step 0 — get to know your browser
Most of the tools you need are already available to you, integrated with the browser — I’m talking about the browser’s developer tools. In most cases you can open them by pressing F12 or right clicking and selecting “Inspect”:
The two most important parts of the Devtools you should be familiar with will be “Console” and “Network”. I will cover those in further sections.
Code linting
While a linter might not help you debug your application it might prevent you from introducing the error in the first place. If you don’t want to spend time configuring and fine-tuning your ESLint (I recommend ESLint here as it’s one of the most popular and powerful) you can use the react-app preset.
Console — your first and most powerful friend
The console window is one of the most important tools at your disposal. Not only does it show all the messages your application is logging using console.log it also shows the majority of error messages in browser caused by your app. On top of that it’s an REPL environment into which you can type any valid JS code and have it executed right away.
console object in JS has a lot of features — if you want to read up on them I highly recommend the page over at MDN.
console is also your “basic” way to debug the application. Want to see if certain part of your code is reached? Is the onClick handler called? What’s the value of that variable? console.log it — in most cases the otput (or lack of it) will allow you to quickly assess what’s wrong with your application.
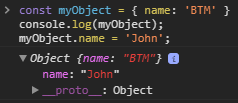
Keep in mind: console.log when used with an object/array as a parameter can be deceiving. Consider the following code:
What do you expect to see in the output of the log?
“Yes, ‘BTM’, just what I thought!” Is it?
Ok …. what’s going on here? console.log uses the reference when we expand it with the arrow down, but the value in the collapsed version. Keep that in mind when trying to debug React application — it might look like the valid data is passed to a child component while in fact it is being mutated in parent!
Network tab
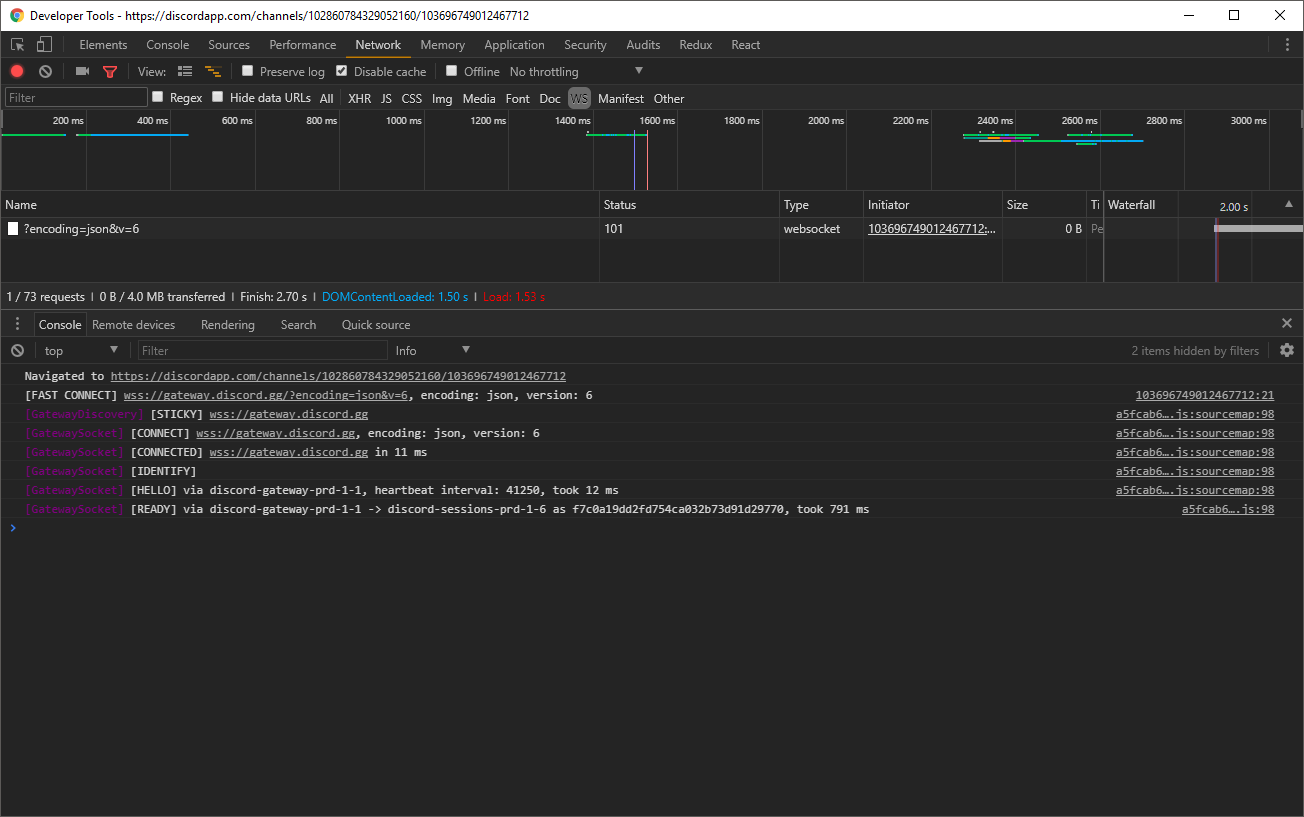
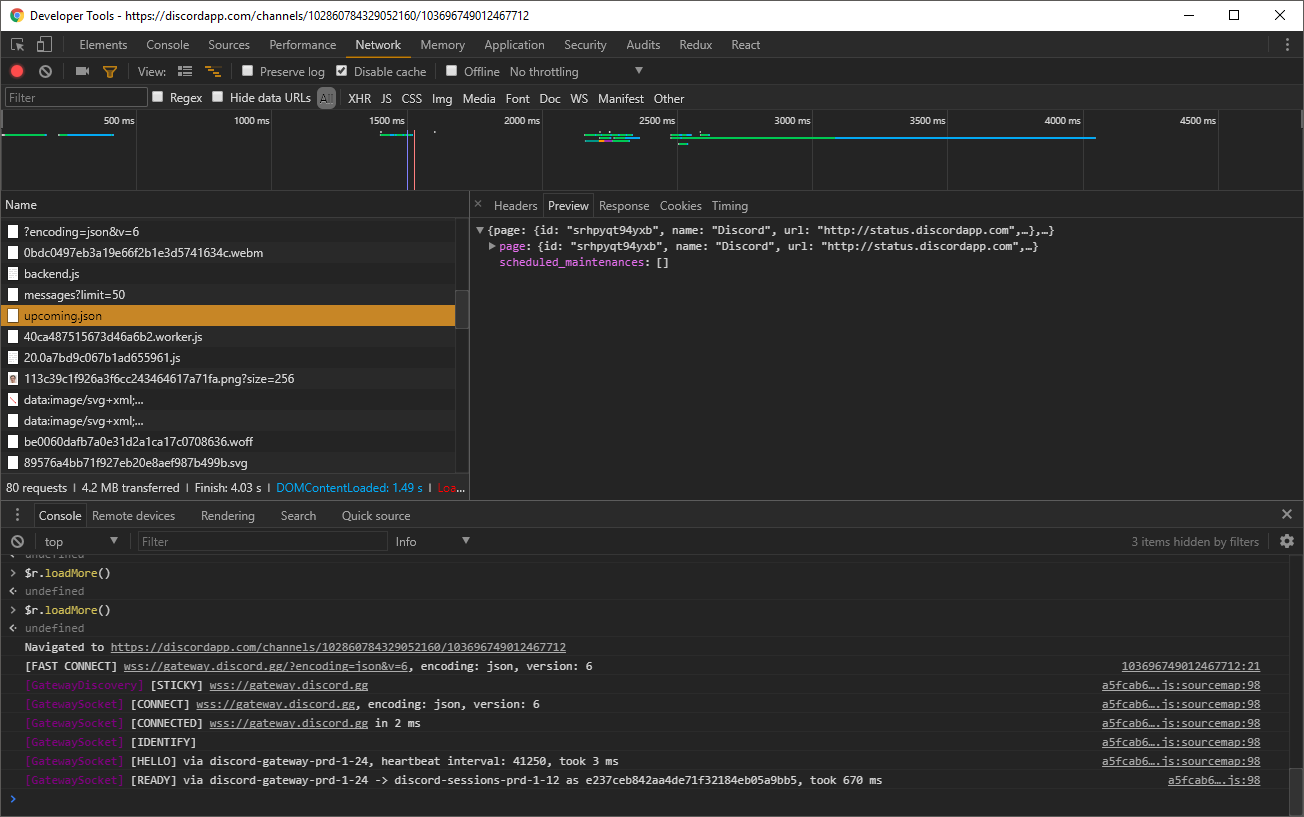
There is a very high chance that your application uses some form of communication with a server, and ther ewill be times that you will get wrong data or data will come in a shape you weren’t expecting it. The Network tab is your “go to” here. It will track all HTTP and Websocket requests that happened since you opened the tool (this is sadly not true for Websockets — it will only show communication happening over sockets that were opened after you opened the Developer Tools, so if you need to spy on WS remember to have the tool opened beforehand):
Important things to keep in mind:
The CORS error is especially tricky as it will show as a successful request (it will be white on the list) and all the data you expect will be there in “Preview” tab. To get around CORS “limitation” you need to either work with the backend provider (in order to allow CORS on the server, or configure it in a way that it can be used by your app) or use a proxy solution (CORS affects only browsers — any proxy written in a server-side language will just ignore it).
React Developer Tools
A deceivingly small browser extension from Facebook will be your go-to tool when checking if the data and JSX structure is OK. You can either download the extension from the library for your browser or grab the standalone version.
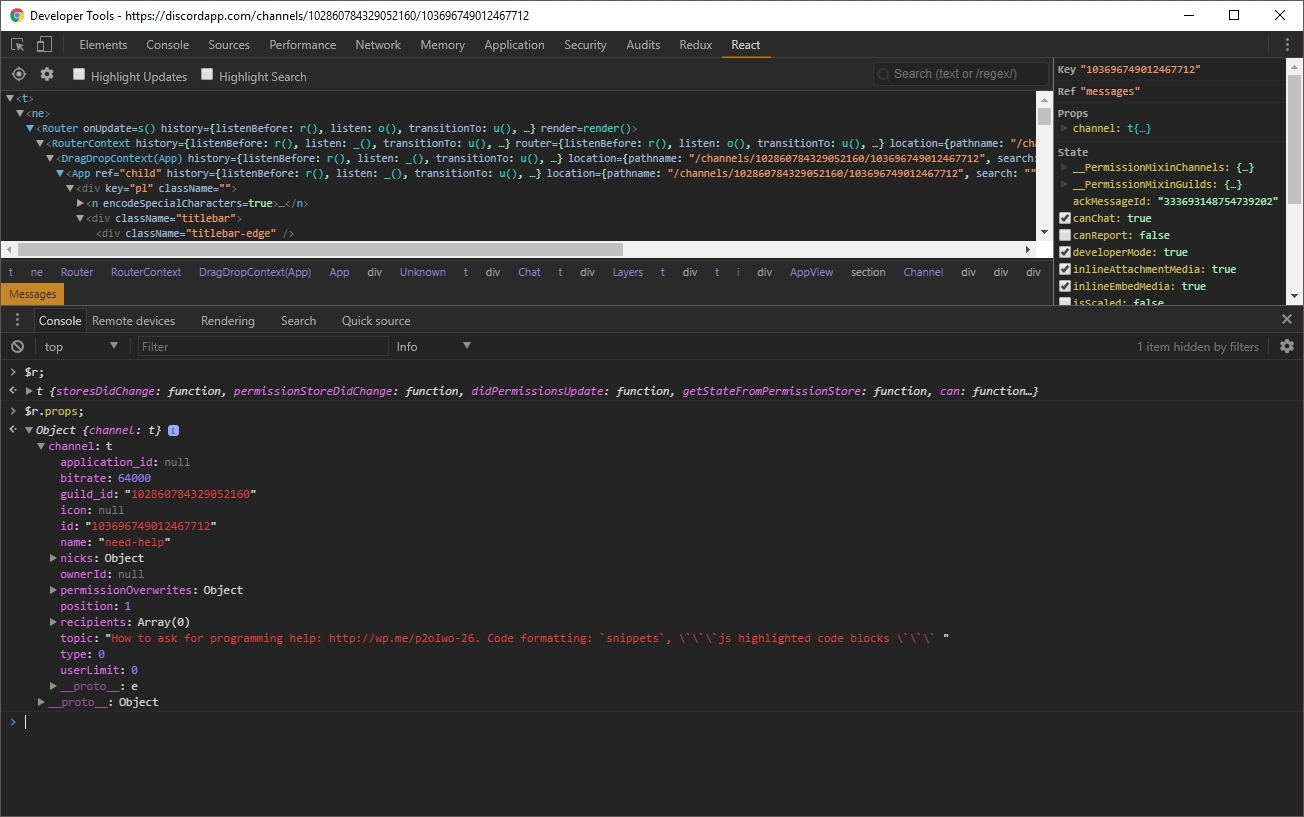
After installing the extension you will notice an React icon on the iconbar that highlights whenever you visit an React powered site, and you will see another tab added to the browser Developer Tools. When opened you will see a view similar to HTML structure but instead of HTML nodes you will see the current JSX:
You can use the “Search” box to look up your components by their name but another feature is the automatic lookup of an element you right clicked and selected “Inspect” on (all you have to do is change from “Elements” to “React” tab).
Important: if you’re running a production build, names of components will be obfuscated by default. You can get around that by setting a static variable displayName on the component. You can use babel-plugin-add-react-displayname to simplify the process.
Serious debugging — breakpoints
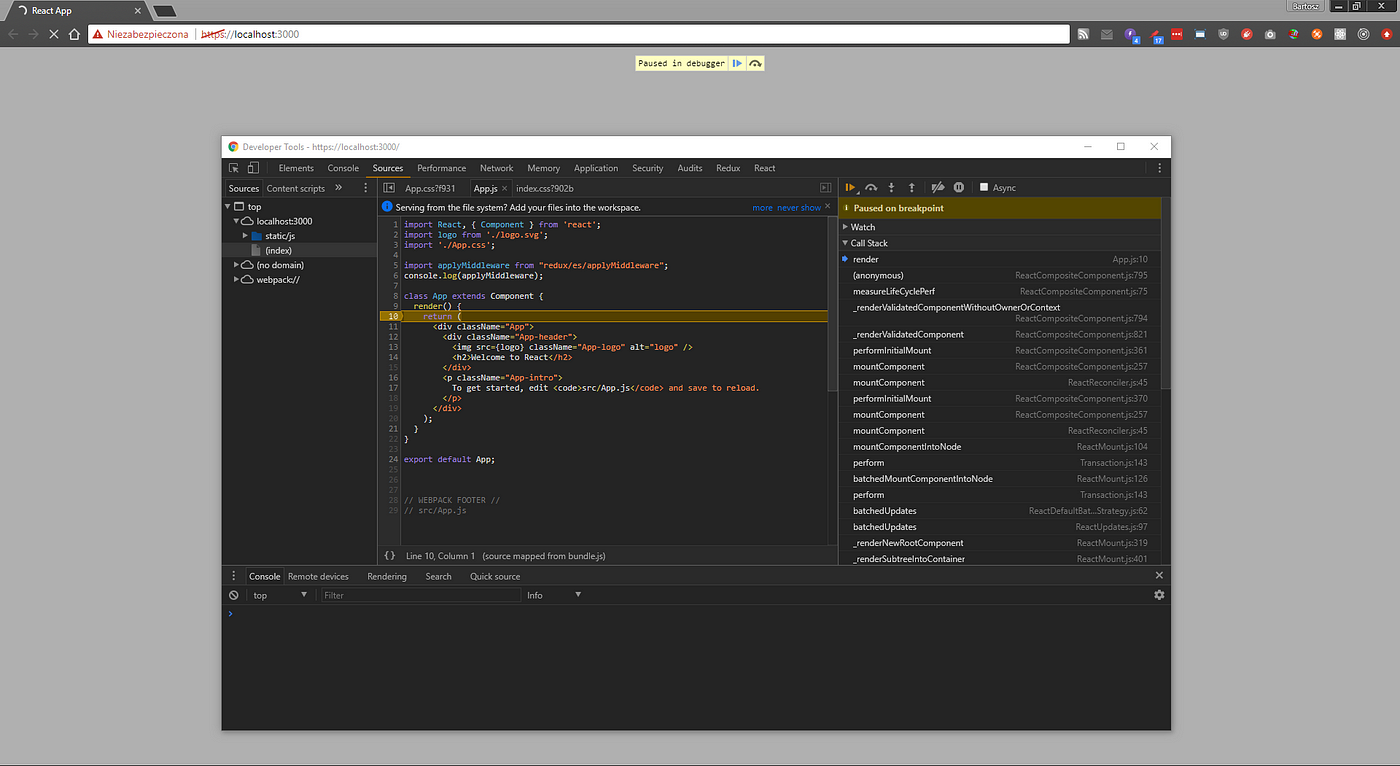
Now that we covered all the “easy” things let’s move into the “real world debugging” — working with breakpoints. A breakpoint is an instruction in code which will stop all the execution and fire up a debugger. There are 2 ways of setting up breakpoints that you will find handy:
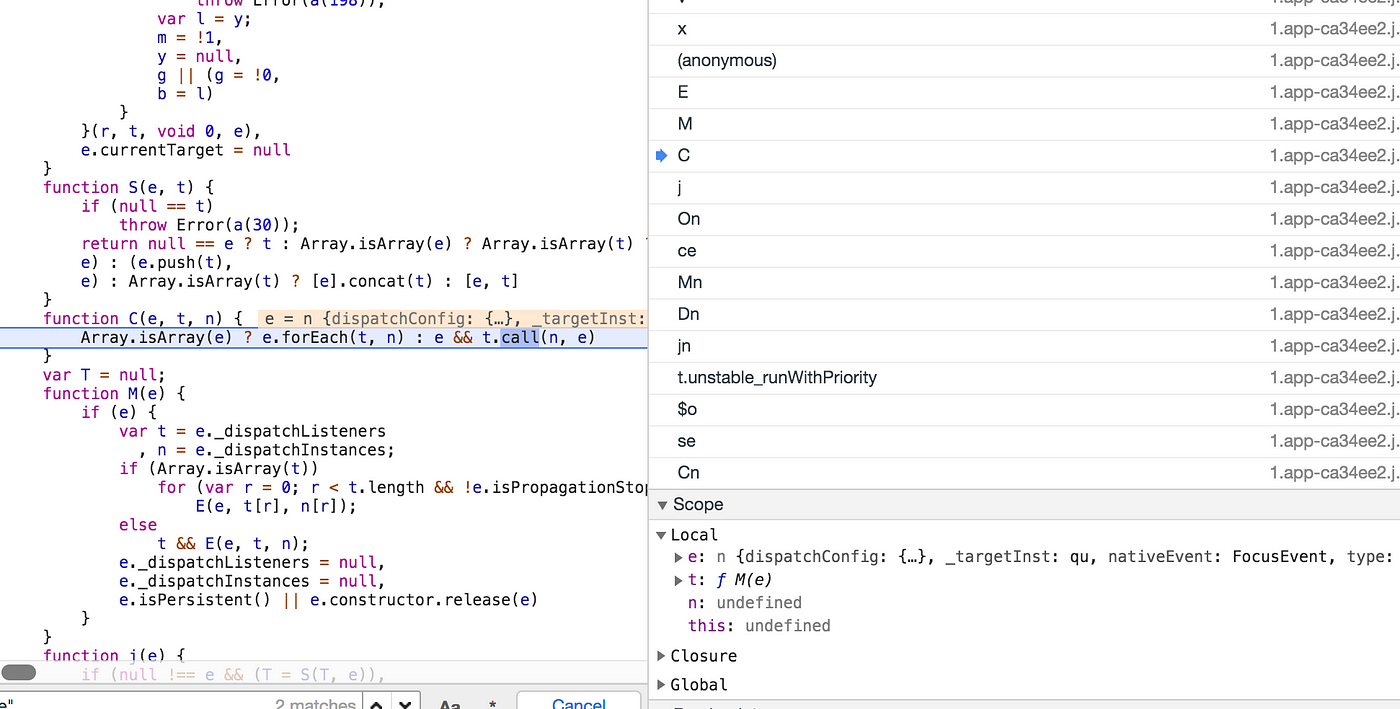
When code execution reaches this point you will see that the page is in “paused” state and the Devtool now have some additional options:
The “Sources” panel shows on which breakpoint the code halted (you can have multiple breakpoints in your application at any given time) and the right hand side shows some interesting information about the current application state, most important are:
Specific tools
While the above described tools will come in handy in any JS / ReactJS application, there are some tools that you might find useful when working with specific issues / libraries, some of which are:
why did you update?
A small library that integrates with your components that shows you why a component did re-render; while the main goal is to provide ways to check for potential optimizations, it is generally useful when debugging rendering issues
redux-logger
Another small console addition, this time for when you are working with Redux. Main purpose is logging out state changes and actions handled by Redux.
redux-devtools
A more advanced extension useful when working with Redux. Comes in two flavors — a library to add to your application and a browser extension. Main selling point of Redux Devtools is the ability to export / import state as a JSON file (so your testers can share the state with developer when reporting bugs) and the “time travel” which allows you to rewind and fast-forward through a history of Redux reducer states.
redux-immutable-state-invariant
Immutability is one of the main assumptions of Redux, but sometimes a mutation slips through. Adding this middleware will help you track such errors by providing console messages when such a situation takes place.
rubber-duck debugging
No really, hear me out on this one.
Have you ever had a situation where you started to explain a weird bug to a colleague only to have one of those “oh FFS, THIS is what’s wrong” moments? There’s a name for that.
Know of any good tools or techniques?
If you know of any good tool or technique that is worth sharing with other React developers, please let me know in the comments bellow 🙂
I’d like to thank acemarke for his help while writing this post.
Отладка React-приложений в VS Code
Прошли те дни, когда мне, в процессе разработки, приходилось тратить время, переключаясь между терминалом, браузером и редактором. Теперь всё делается иначе — быстрее и удобнее. Сегодня я расскажу об оптимизации повседневных дел React-разработчика. А именно, речь пойдёт о том, как связать Visual Studio Code и Google Chrome. Это даст возможность отлаживать браузерный код в редакторе.

Средства отладки VS Code и jest от Facebook
Настройка тестового проекта
Прежде чем мы начнём осваивать отладку React в VS Code, создадим учебное приложение, с которым будем экспериментировать. Я часто пользуюсь create-react-app, так как очень не люблю вручную создавать пустые проекты. Поэтому предлагаю задействовать его и в этом руководстве. Как вариант, если у вас уже есть приложение, вы можете воспользоваться им.
Итак, создадим тестовый проект. Для этого надо сделать следующее:
Настройка VS Code
Теперь установим расширение VS Code, которое позволит редактору взаимодействовать с Chrome. VS Code подключается к Chome с использованием протокола удалённой отладки. Это — тот же протокол, который используют инструменты разработчика Chrome. Но, благодаря такому подходу, вместо того, чтобы работать со стандартными инструментами Chrome, вы можете использовать для отладки браузерного кода VS Code.
Установка расширения Debugger for Chrome

Поиск расширения Debugger for Chrome
Подключение VS Code к Chrome
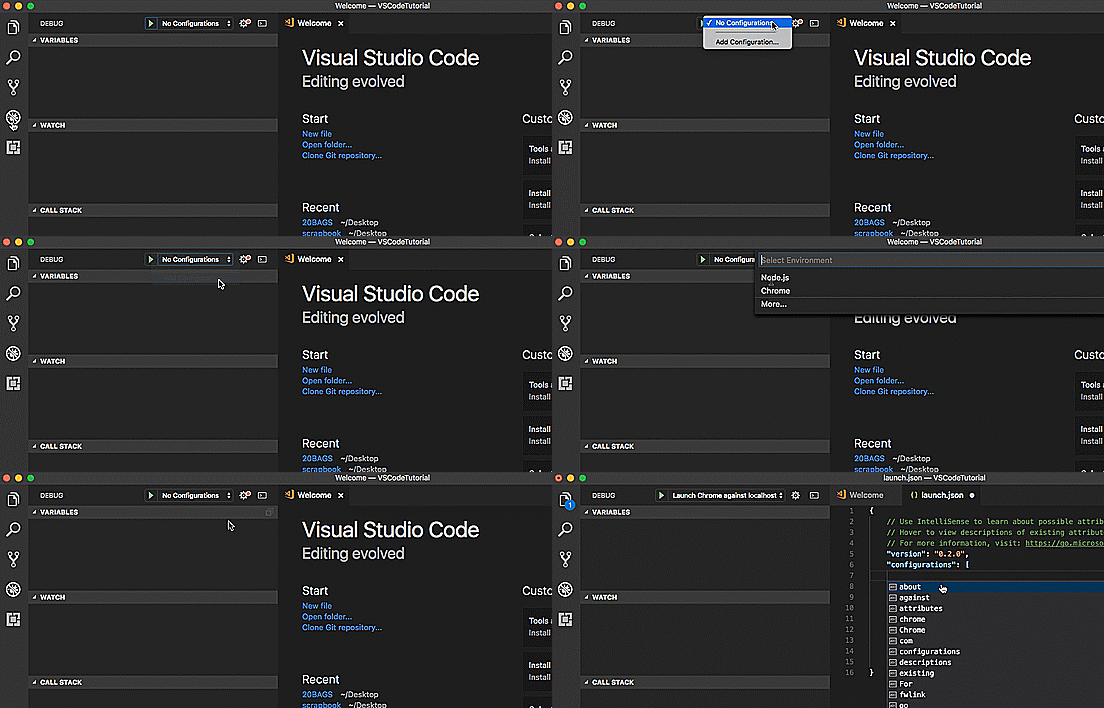
Далее, нужно настроить VS Code на подключение к Chrome. Делается это так:
Настройка связи VS Code и Chrome
Полный список конфигурационных опций можно найти здесь.
Использование отладчика
Теперь почти всё готово к работе. Следующий шаг заключается в использовании тестового проекта для того, чтобы проверить отладчик.
Запуск отладчика
Запустить отладчик можно, выполнив одно из следующих действий:
Панель инструментов, которая появляется при включении отладчика
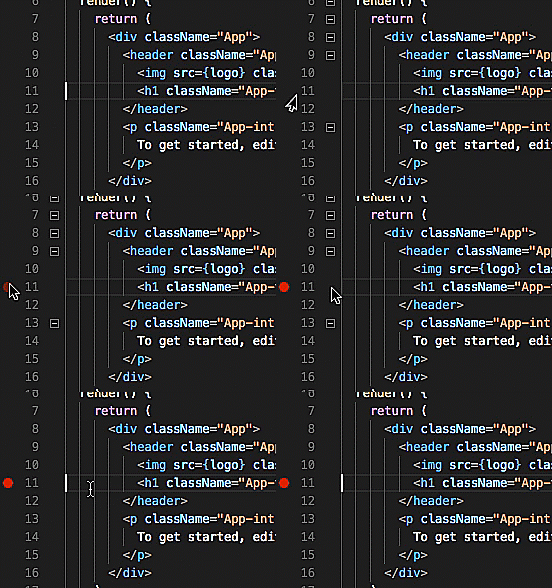
Установка точки останова
Точки останова используются для того, чтобы сообщить отладчику о том, что ему нужно приостановить выполнение кода в определённом месте. Это позволяет программисту исследовать переменные, стек вызовов и вносить в код изменения в процессе выполнения приложения.
Установка точки останова
Запуск сервера разработки
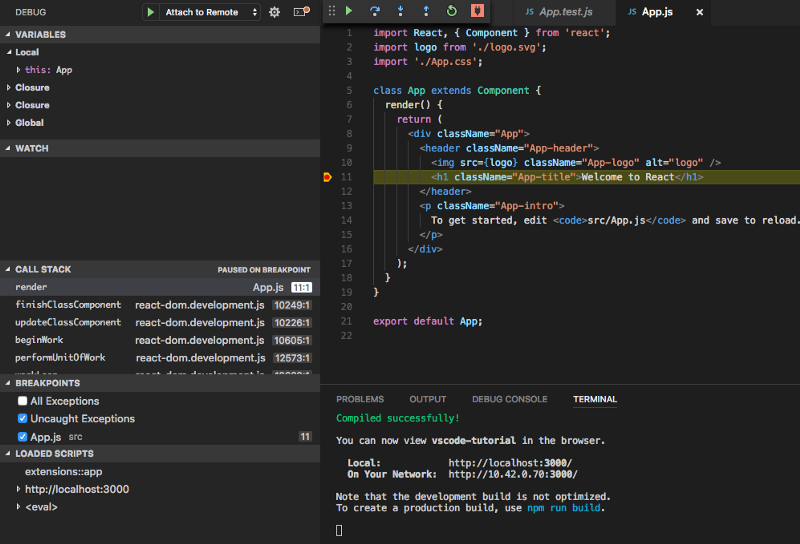
Перейдите по адресу http://localhost:3000/ и вы увидите, как страница «застынет». Это происходит из-за того, что сработала точка останова. Если перейти в VS Code, можно заметить, что строка 11 будет выделена, а на панели отладки появятся сведения о стеке вызовов.
Сработавшая точка останова
Если у вас всё заработало — примите поздравления! Вы только что узнали о том, как настроить удалённую отладку в VS Code. Если вы хотите узнать подробности о самом процессе отладки в VS Code — почитайте это.
Непрерывное тестирование с помощью jest
Непрерывное тестирование в VS Code
Итоги
В этом материале мы рассказали о том, как настроить взаимодействие VS Code и Chrome для организации удалённой отладки React-приложений. Надеемся, эта простая методика поможет сэкономить немного времени, если раньше вам приходилось постоянно переключаться между редактором, браузером и терминалом.
Уважаемые читатели! Пользуетесь ли вы какими-нибудь полезными мелочами, которые повышают производительность труда при разработке веб-приложений?
How to debug ReactJS applications
Knowing how to effectively debug an application is of the utmost importance to frontend developers as they’ll be spending a good portion of their time reproducing and fixing issues. Besides, what better way of deeply understanding a language or framework if not by looking at its inner workings.
In this article, we’ll be covering some of the tactics and tools ReactJS programmers use on a daily basis, not only in their very predictable development environment, but also in production when their code comes to life and things may — and will — go haywire.
(Most of the learnings here are applicable to all frontend applications)
React debugging tools
One of the popular extension out there is definitely the React Developer Tools available on both Firefox and Chrome. It makes it easy to inspect and edit the props/state of the root React components rendered on the page and record performance information.
But the best debugging tools are already bundled with your browser. The good old “inspector” will boost your productivity when it comes to debugging JavaScript, tweaking DOM and CSS, inspecting network activity, analyzing performance, tracking down memory leaks and much more.
How to debug with Chrome DevTools
Let’s hit F12 and get familiar with the different panels.
Console
The Console serves two objectives at least: display of your application’s logs plus runtime errors and ability to execute custom JS code.
Developers may be logging messages using console.log() to inspect the value of some variable or simply ensure their code is executing in the right order. Warnings and majority of runtime errors get also printed here. See console JS object to learn what you can do it with it.
Network Panel
This where your entire application’s network activity will be logged. All resources, whether downloaded or uploaded, are available for inspection in the Network panel. These resources are listed chronologically with information such as HTTP response code, loading time, initiator, state and size. The footer contains a summary of the total number of requests and the size of all resources.
This list view helps easily spot requests that failed (the red ones) and those that are pending and may soon timeout. If you’re looking for CORS issues, it’s better to start from Console then eventually switch to Network (these requests appear in white, as successful).
Clicking on a specific resource opens a detailed panel where HTTP Headers are shown, alongside the Response and even an HTML Preview of it. It’s in fact easier to debug the received data or simply inspect images here than in your HTML source code.
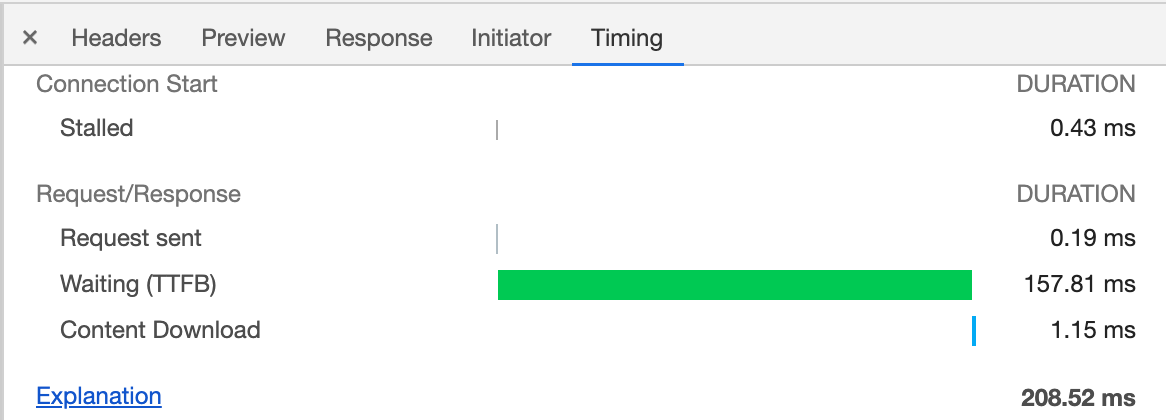
And finally the Timing breakdown which can prove very useful when investigating requests that take a long time to download, either due to a poor connection between your React application and the server (consider using a CDN if Time To First Byte is high) or to a slow backend if that server is hosted locally.
Tips: Hit Preserve log to keep the logs when navigating from one page to another, and check Disable cache so resources won’t be served from cache when DevTools is open.
JS Debugger
This is by far the most powerful tool available in DevTools, and you can find it under the Sources tab.
This a faster and cleaner alternative to using console.log() when looking for bugs. It allows for quick inspection of the piece of code being executed and the values of all variables at that moment in time.
The execution comes to a halt as soon as it reaches the breakpoint. And you can set many of them at the same time. From there you can deep dive into your code using the different options at hand:
Other types of breakpoints are available:
From the same Sources panel, you can save your repetitive code into Snippets. They have access to your JavaScript context and can be run anywhere in your application.
Store Specific Tools
DevTools might not be enough whenever you need to deep dive into some specific issues related to your store. Here are some of the tools you may use for Redux and MobX.
Redux
HTML Structure & CSS
The Element tab is where you do all your DOM related activities. It allows you to edit the DOM and CSS on the fly.
You can inspect any particular DOM node, change its content, attribute or type and force its state (like :hover ). You can remove nodes or reorder your tree by drag and dropping them and see how it renders.
DevTools lets you also use nodes in Console and even store them as global variables in case you need to refer back to them. But perhaps the most useful trick is to pause your JavaScript whenever it tries to update a DOM node. You can do that by adding a break on attribute change, node removal or subtree modification.
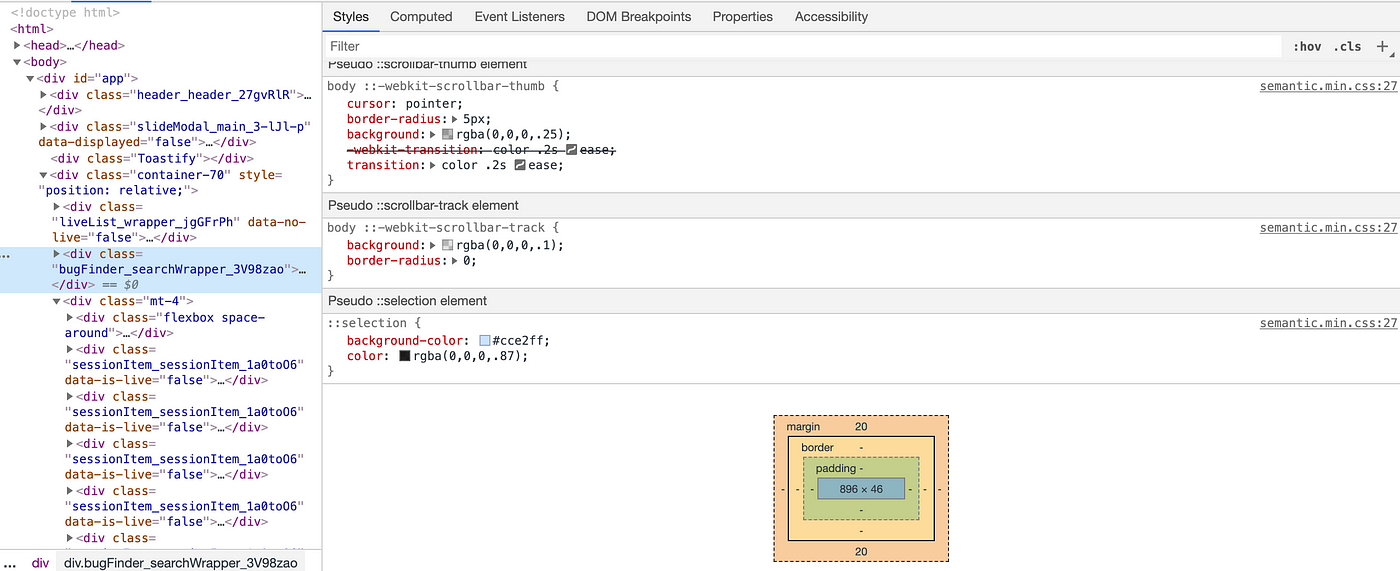
On the right side of the panel you can see the CSS styles that are applied to the selected DOM element. DevTools lets you inspect styles in different ways by editing them, or by adding new styles and rules. The box at the bottom helps with the margins, paddings, dimensions and border.
Make sure to persist your changes to the development workspace if you don’t want them to disappear upon the next reload.
Performance Audit
DevTools offers several ways (across various panels) to audit and improve the performance of your React application.
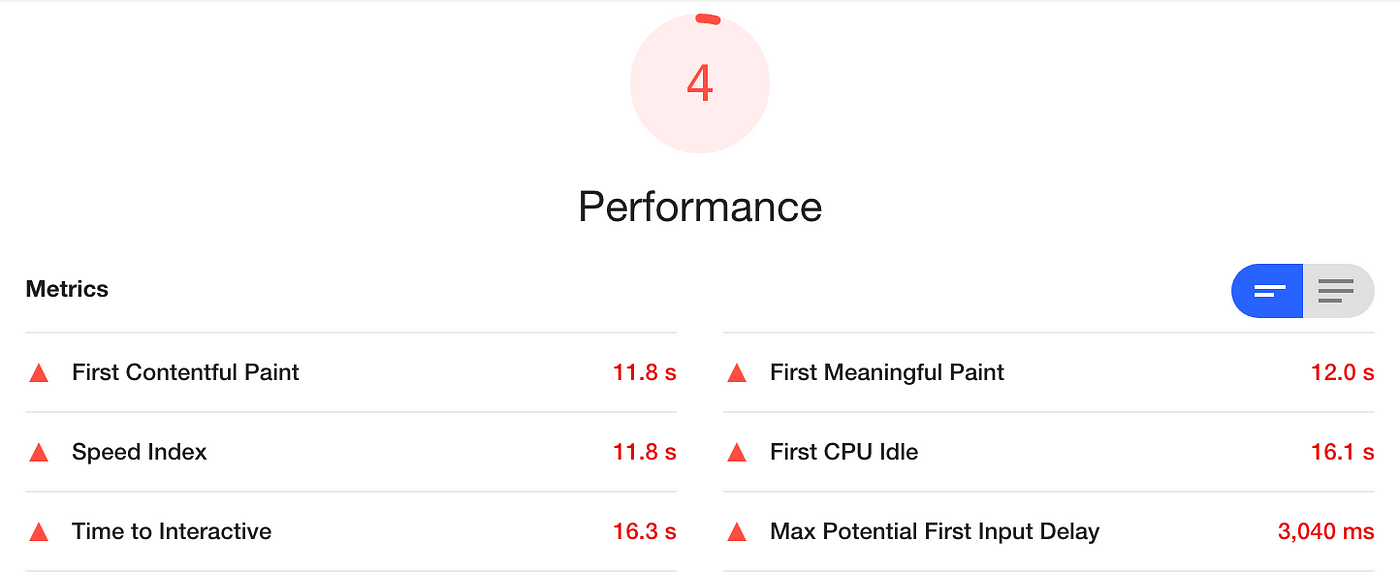
The Audits tab is where you can look for bottlenecks hurting your page’s loading speed. Open your application in incognito mode as some browser plugins may interfere with the auditing workflow.
Start with an audit as it creates a baseline to measure your changes against, but also gives your some actionable tips on how to improve. The available options let you run different categories of audits: SEO, accessibility or performance oriented. It also helps simulate how your application behaves on a mobile device (viewport and bandwidth/CPU throttling).
Results show the overral score (the higher the better) and a set of different sections:
Tip: Isolate your changes by making one improvement at a time, before rerunning an audit for measuring how it affected performance.
Memory issues are obvious and often times noticed by your users as your application will tend to either pause ( GarbageCollector kicks in more frequently than it should) or becomes slower throughout the session (think memory leak).
A dedicated Memory tab helps investigate these issues. Track down memory leaks by monitoring your JS heap (in Allocation timelines) and by finding detached DOM nodes — those removed from the tree but still being referenced by some JS — using Heap snapshots. You can even dissect memory allocation by function.
Learn more about this topic here.
You can record a JavaScript CPU profile and examine the functions that have impact on your application’s performance. Results can be shown in 3 ways: top-down (tree), by impact(heavy) or chronologically (flame chart).
Frames per second
FPS is captured alongside other metrics by DevTools at execution time. It is useful for spotting slow animations that hurt your user experience. Low framerates translate in red bars on the chart.
DevTools also offers an FPS meter, producing real-time estimations at runtime, and CPU throttling for simulation on mobile devices.
How to debug Production issues?
Issues reported by users do often lack the full context to have a complete understanding of what happened. “X doesn’t work” doesn’t obviously help you. Not to mention the time it takes to collect clues from your users with the hope of being able to reproduce the problem locally. Besides, how many of them would bother to submit a ticket or share a bad experience? An extremely tiny fraction I guess.
So don’t go easy on logs. Anything that helps you make sense of a bug is useful. Below are a few tips on what’s worth tracking.
Monitor your XHR
Make sure to log the XHR requests that failed (5xx/4xx) and their responses. Most HTTP libraries will allow to easily handle such cases.
Catch your JS errors
Runtime errors are critical for diagnosing issues. They are worth a thousand log entries and provide an accurate picture of the problem. Store them on your server for later retrieval. If you had to log only one thing, start with JS errors.
Track your app’s State and Actions
Whether using Redux, MobX or any other store, take the time to log your application’s state changes and actions. You can even replay them in your browser, if you’re on Redux, with redux-slider-monitor. This would come in handy for thorough debugging of production issues.
Record your user actions
Logging user actions and journeys is a powerful, yet underused technique in debugging. Such strategy is widely used by marketers who track down each and every frustration that may affect the overall user experience, ranging from rage clicks to incorrect rendering of certain elements in the web app. Tools like Mixpanel, Amplitude or Heap haven’t been designed for developers and therefore rarely used by them. But this is not an excuse for not simply logging your user steps after sanitizing any residual private data.
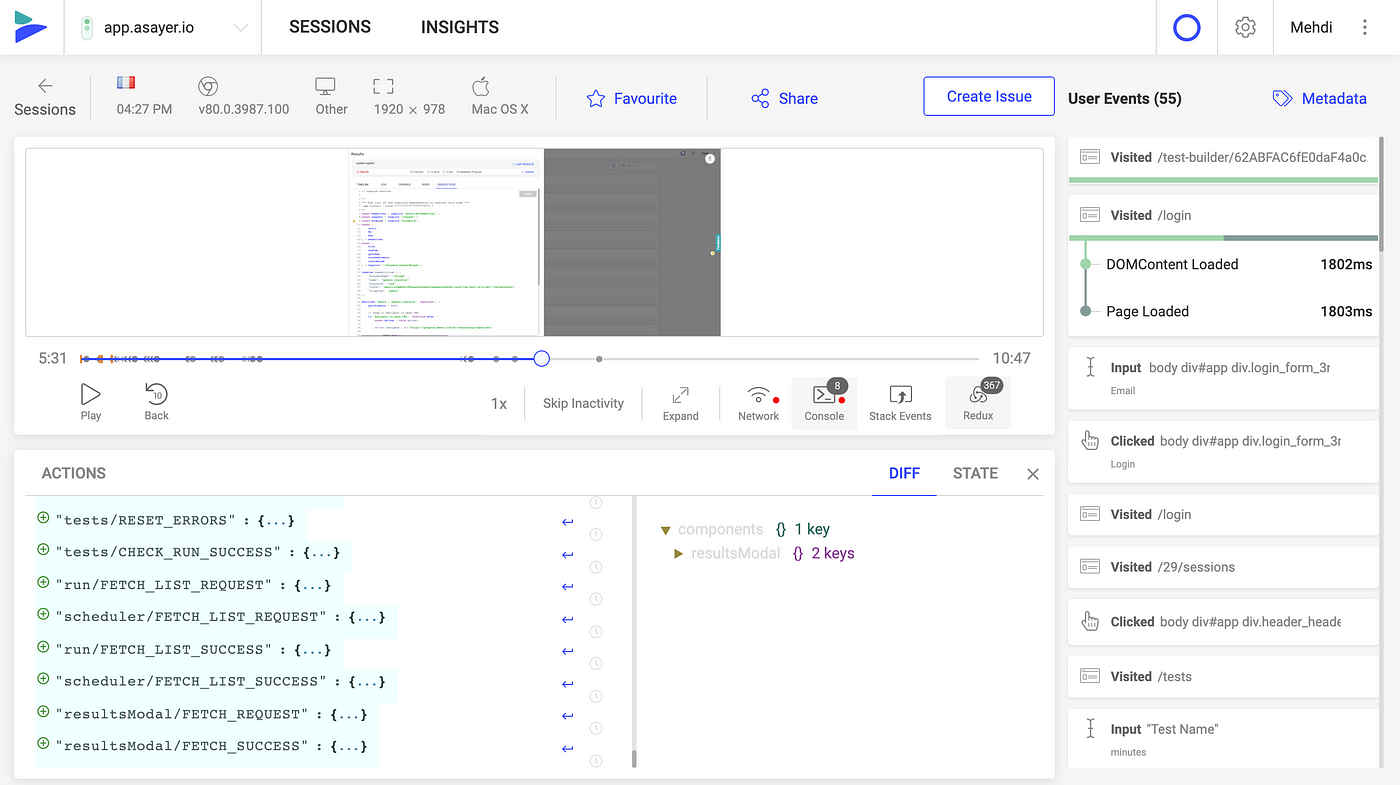
In fact, being able to mentally visualize your user journey — while they experience an issue in production — and at the same time see how that affected your React stack is simply HUGE. It’s the ultimate root cause analysis technique and a serious productivity booster.
Monitor React apps in Production
Debugging a React application in production may be challenging and time consuming. Try using a unified monitoring platform that gathers all you need for troubleshooting in one single place. Try Asayer for free.
Asayer is a frontend monitoring tool that replays everything your users do and shows how your React app behaves for every issue. It’s like having your browser’s inspector open while looking over your user’s shoulder.
Asayer lets you reproduce issues, aggregate JS errors and monitor your app’s performance. Asayer offers plugins for capturing the state and actions of your Redux/MobX stores and for inspecting GraphQL queries.
A complete guide to getting started with React debugging
Debugging is the art of removing bugs — hopefully quickly, and in this guide, I’ll show you multiple ways to debug React. In terms of React, we can have many different kinds of bugs, including:
There are more categories than this, but it’s enough to get started debugging in React. Let’s open by talking about how to create a small application using React and how to debug it.
How to install Node.js and npm
Before getting started, make sure you have a recent version of Node.js and npm (the package manager) installed. I recommend going with the most recent LTS (long-term support) version. Since npm is bundled with Node.js, you won’t have to install it separately.
We’re ready to create our project now.
How to bootstrap a React project
To get started, let’s bootstrap a project using Create React App. It’s a popular project, especially for learning React. That’s because it encapsulates many of the development-environment-related best practices.
How to create a counter application with React
To keep things simple, I won’t teach you how to use React. After all, the official React tutorial covers that need well enough.
Instead, I’ll get straight into creating a counter application. To follow along, paste the following code adapted from React hook documentation to src/App.js :
After pasting the code to the file, you should see a button labeled “Click me”. Pressing it should increment the value visible above the button. See the image below for what the application should look like after it’s running.
How to debug React using Console statements
Now, you might be wondering how to open the browser inspector. The inspector won’t be shown by default; you have to activate it either using a shortcut or a browser menu (usually named Developer or something similar).
How to debug React using the browser inspector
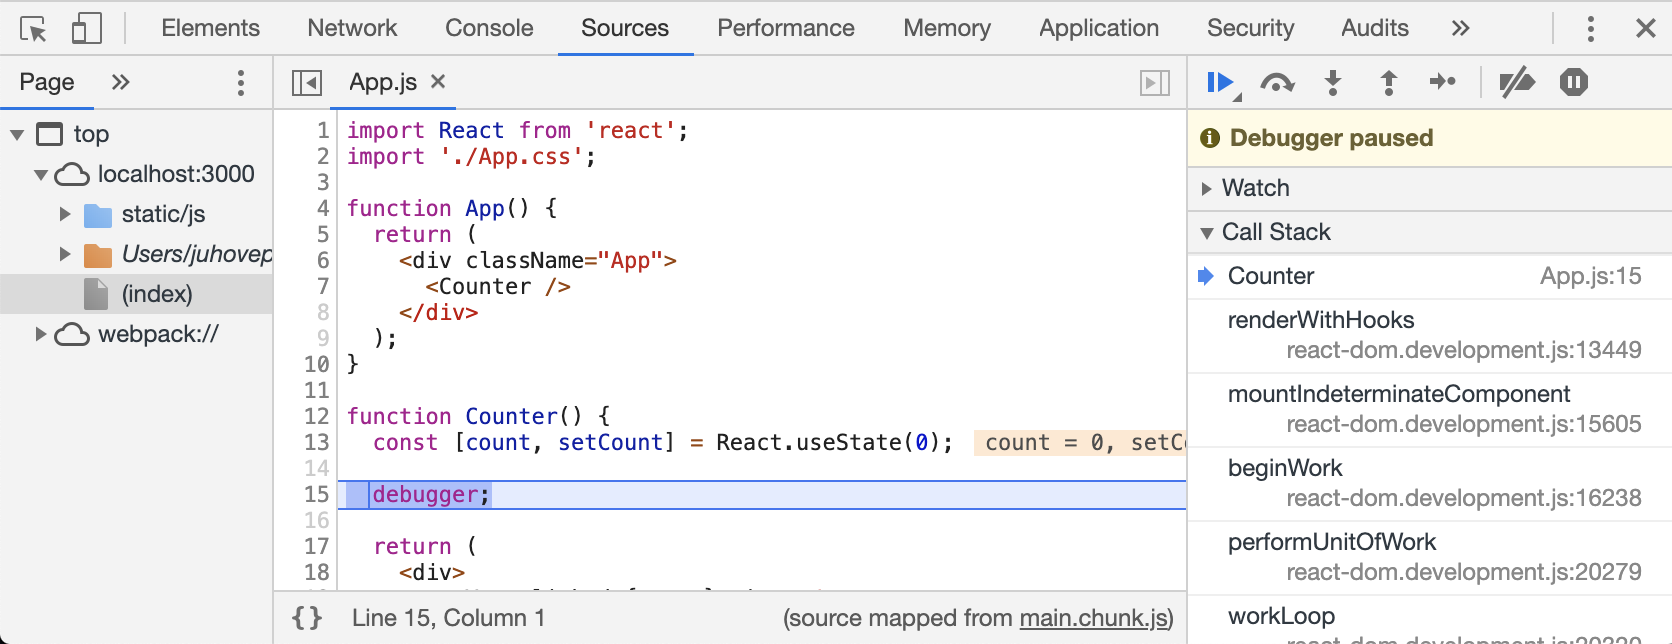
The browser inspector contains many powerful tools, including a debugger. It can be activated from the code by using a debugger; statement. Writing debugger; is the same as if you were adding a breakpoint to your code using the browser. Here’s what debugging using the browser inspector looks like:
To get started with this, do the following:
Now that the application is in a frozen state, you can inspect it in various ways. Consider the following examples:
There’s functionality beyond this, including value watchers. But the above is enough to give you some idea of how powerful debugging within a browser can be.
How to debug using React DevTools
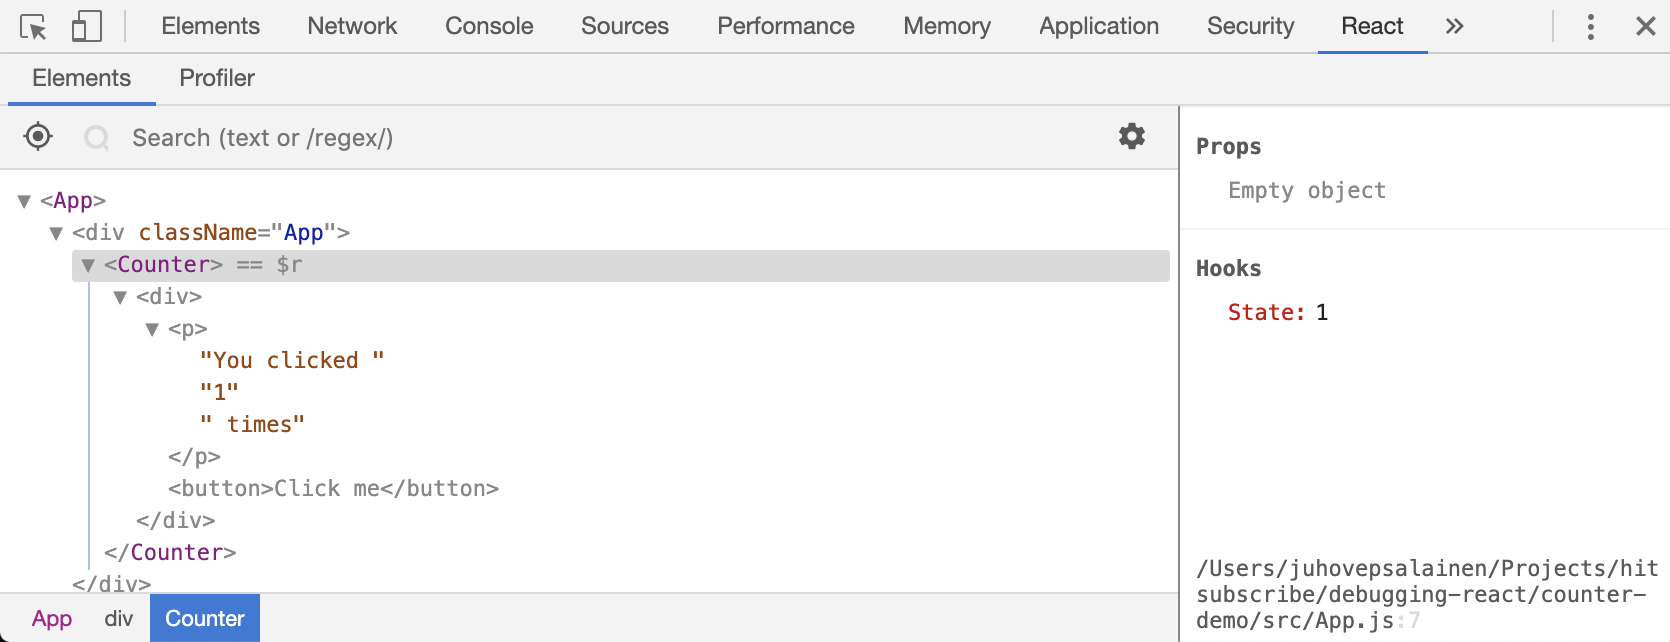
To debug React better, it can be a good idea to install React Developer Tools. It’s an extension for Chrome-based browsers and Mozilla Firefox that implements React-specific debugging functionality. After installing the extension, open the React tab in your browser. You should notice the Elements and Profiler tabs.
How to debug React Element Tree
The Elements tab of the extension lets you see the application element structure and the state associated with it. In the case of our application, you can see the current count if you click on the Counter element. It’s also possible to narrow down the visible elements using a search.
How to debug React performance
In order to debug performance issues, the extension comes with a profiler designed for React. The functionality complements browser functionality (i.e., the Performance tab at the inspector) while providing React-specific insights. To use the profiler, do the following:
In the case of this application, there isn’t much to see, but the functionality is valuable when you’re debugging something complex.
How to debug React networking issues
Usually, an application is connected to a remote backend. That brings a new source of bugs, as the data you receive from a backend might not be what you expect. Or perhaps you made a mistake in your query. To debug these sorts of issues, consider using the Networking tab of the inspector. You’ll see all sent network requests there, and you’ll be able to inspect their contents further.
Doing this work in tandem with another technique, such as inserting a debugger; statement into a good place, can be a decent way to debug these issues.
How to debug React and Redux
If you’re using Redux with your application, Redux DevTools Extension gives you insight into the state of your application at a given time. The extension also allows you to travel in time through different states. It requires a certain amount of setup in your application. but it’s all explained in the documentation of the extension.
How to debug React regressions
Assuming you’re using Git to manage the versioning of your application, there’s a special command that you can use to catch regressions in your application. If you know that a certain functionality worked in the past but is broken now, Git can help you to find the revision where the functionality broke. The command is called git bisect.
Bisection is a type of search where the search space is halved on every search. The way it works is as follows:
Eventually, you should reach a result as Git is able to pinpoint where the functionality broke. Now that you know where things went wrong, you can check the changes introduced in the commit and be able to reason better why it broke the functionality.
When bisecting, you should take care to npm install the correct versions for each commit. This is particularly important if the package version changed during the commits, as it’s possible package APIs have changed during updates. Bisecting is also one of the reasons why it’s a good idea to keep your commits relatively small and focused: it’s easier to reason about your code.
Final considerations
When debugging React, you should first determine what you’re debugging. Then, you can decide what techniques to use based on that. Debugging is usually an interactive process, in which you interrogate the application to gain insight into why the behavior doesn’t match expectations.
There are further ways to perform the above in a more automated manner. For example, you could use the React APIs to measure rendering performance while testing or use tests to assert certain behavior. After debugging a fault, writing a test to assert the new behavior can help you avoid regressions in the future.
One last consideration is runtime behavior. Before you can fix an issue, you have to be able to know about it. That’s where services like Raygun Error Tracking come in, as they’ll let you track what happens when the application is in the hands of the user. You’ll want to capture possible issues for developers to fix. After all, if you don’t know what to fix, you can’t fix it.
Performance Matters
The best software performance articles from around the web delivered to your inbox each week.
Your information is safe with us. Read our privacy policy.

